


[Two wonderful people and superb political scientists who discovered and taught many important features of congressional politics passed away in the last two years. Roger Davidson was a keen observer of the Congress’s organization and rules and their consequences for policy making. Dick Fenno was a leading scholar of legislators’ behavior in Washington and at home. Anyone who has been close to the study of Congress in the last generation misses them. (June 2021)]
Among the many, many contributions of political scientists Roger Davidson and Richard F. Fenno, Jr., was the observation that the public, on balance, liked their member of the House of Representatives but disliked Congress. The pattern, discussed in a 1975 essay by Fenno, became known as “Fenno’s paradox.” The evidence that drew the attention of Fenno, Davidson, and others in the 1970s was that nearly all House incumbents (and most Senate incumbents), and many by wide margins, but only about a quarter of the American public answered survey questions about whether they approve or disapprove of the way Congress was doing its job.
Davidson had addressed the issue in a 1965 book, but he and Parker followed up on Fenno’s essay in a 1979 paper that examined the scant survey data that probed the motivations behind evaluations of Congress and legislators. They confirmed what Fenno suggested—the American public evaluates Congress on the basis of different criteria than it uses to evaluate their own elected representative.[1] Congress was evaluated, usually unfavorably, on the basis of its legislative record and the messiness of legislating; members of Congress were evaluated, usually favorably, more on the basis of their service to their districts and their personal qualities.
Reconsidering the Davidson and Fenno Arguments
We have reason to reconsider the way Davidson, Parker, and Fenno solved the Fenno paradox. In recent decades, the “incumbency advantage” has weakened as more and more voters appear to be voting on the basis of party affiliation. To the extent that party preferences have become important to more voters, the personal characteristics and nonpartisan activities of the incumbents have less influence on election outcomes. The evidence, cited in Note 6, appears to support this account: the party vote is now much stronger than the personal vote. A legislator in tune with his or her electorate on partisan and national issues has lesser need, and perhaps less opportunity, to influence voters through personal activities.
A stronger party vote and weaker personal vote does not mean that the personal vote has disappeared or that incumbents lose their reelection bids more often. Neither is true.
We can think of the personal vote as related to, but not identical with, the incumbency advantage.[2] The former concerns personal qualities and activities that voters like and may cumulate into a positive reputation for a candidate—perhaps more likely for incumbents who have been in office for some time, but challengers and open seat candidates certainly can have personal qualities that advantage them. A “pure” incumbency advantage may simply be the name recognition, or “cue taking,” that benefits incumbents when voters see only a name and a party label on the ballot. The common way of measuring the incumbency advantage, described in Note 6, captures both personal vote advantages and name recognition advantages that incumbents may have. We know that the incumbency advantage has declined, particularly in the 2010s, but the advantages associated with being in office have not disappeared. Party has become more important and incumbency less important, but personal qualities and incumbency are still important enough to make the difference in close races.
Figure 26-1 shows the reelection rates for House and Senate incumbents who seek reelection. In the 21st century, mean reelection rate shown in the figure is 94 percent for House incumbents and 85.4 percent for Senate incumbents. The rise of more nationalized congressional elections has not created more trouble for incumbents, at least not on average. The good fit to their electorates that national party and policy considerations generate dampen incumbent defeats and minimize the number of misfits that face serious reelection challenges.

Congress’s Approval Ratings in Recent Decades
As Fenno noted in the 1970s, surveys commonly showed about a quarter of Americans approve of the way Congress is performing its job. Things have not changed much. The mean percent approving of Congress’s job performance in Gallup polls since 2000 is 26.6. There is considerable variation, however, as Figure 26-2 shows. Congress reached the 50s shortly after the terrorist attacks of 9/11 in 2001 when it quickly passed legislation to address the security threat. It reached low points in 2011-2013 when the majority Republicans in the House sought to use their leverage over spending and the debt limit to force concessions from President Obama and a Democratic Senate, leading to a government shutdown of more than two weeks in 2013.
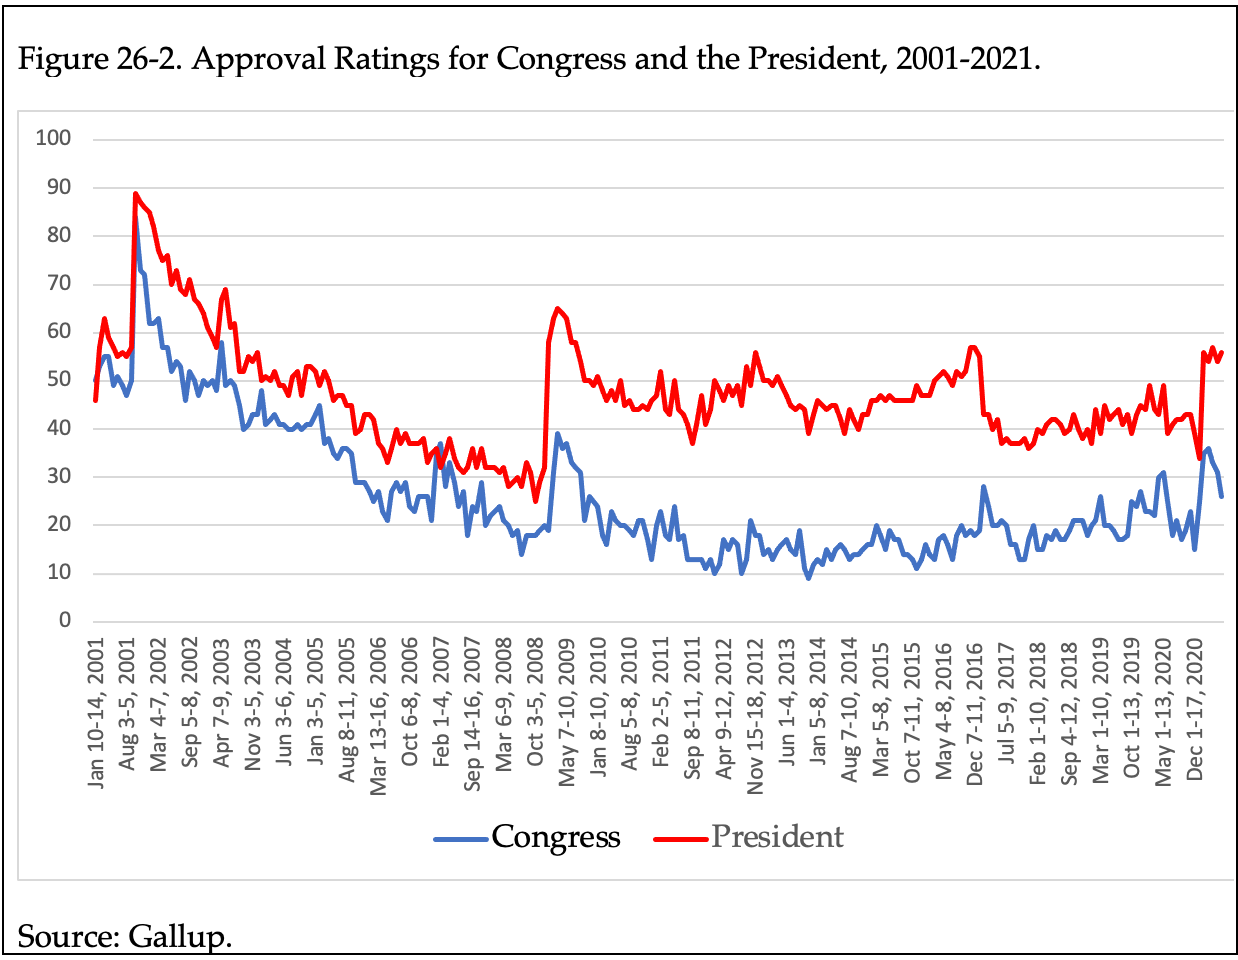
As Figure 26-2 illustrates, Congress’s approval rating parallels the president’s approval rating. The figure provides the Gallup measure of the percentage of respondents who reported approval of “how Congress [the president] is handling its [his] job.” The correlation between the two times series is a healthy 0.71.
The president almost always enjoys a higher rating that Congress. In major part, this appears to be a response to the president’s struggle with Congress. Nearly all of the president’s partisans in the general public approve of the president but many of them disapprove of Congress when it fails to act quickly. The partisans of the out-party disapprove of both the president and Congress. The president and the Congress are rated the most highly when they cooperate, as they did in the aftermath of 9/11 early in the Bush administration and in the first year of the Obama administration. The actions of the Biden administration and Democratic Congress on the pandemic and economic challenges in early 2021 also boosted approval ratings of the president and Congress. At the time of writing this update (July 2021), it appears that Congress’s struggle to do more than what was done early in the year is causing a dip in its job approval while the President Biden is holding steady. [3]
Confidence vs Approval
Political scientists and pollsters often distinguish between job approval, which is reported in Figure 26-2, and confidence in institutions. Gallup is the most frequently noted source on these measures. The two Gallup questions:
“Do you approve or disapprove of the way Congress is handling its job?”
[a list of institutions is provided] “How much confidence do you, yourself, have in each one—a great deal, quite a lot, some or very little?”
There is a possibility to Americans may disapprove of the way Congress is performing at any moment and yet have confidence in Congress as an institution. The former may reflect recent disappointment on specific issues; the latter may reflect confidence in the American constitutional system.
It doesn’t work that way. In June 2021 the percent responding “a great deal” or “quite a lot” to the confidence question for Congress was 12. If we include “some,” it jumps to 49. The approval rating for roughly the same period was 26. A reasonable guess (but I do not have access to the data to be sure) is that respondents who answered “a great deal” or “quite a lot” also approve of Congress’s job performance and the “some” respondents were split on approval.
Gallup reports confidence ratings once a year for the period since 1973. The confidence ratings for Congress are shown in Figure 26-3. Comparing Congress’s approval rating since 2000, as shown in Figure 26-2, with the confidence rating in Figure 26-3, the same trend is evident. Confidence, like approval, was higher (but not really high) in the aftermath of 9/11, reached a nadir in 2013 and 2014, and has stayed low since then. In fact, the “great deal/quite a lot” combination yields a level of support for Congress remarkably close to the approval rating at most times.

Party and Congressional Approval
It is not surprising that congressional approval is related to the partisanship of the respondent. It may be more of a surprise that the ratings of Democrats, Republicans, and independents move together much of the time. To illustrate this, I shift to the American National Election Studies (ANES), which uses a somewhat different question than Gallup and yields higher approval ratings than Gallup. ANES is not the best measure because it is in the field only every two years for a few weeks in the fall and only for the period since 1980.
As Figure 26.4 shows, the overall pattern since 2000 is similar to the Gallup pattern shown in Figure 26.2. Here, for a longer period, there is a strong tendency for the three partisan groups to move together. In addition, the partisans of the party that controls both houses tend to give Congress a higher rating. Frustration with a gridlocked and hyper-partisan Congress generated low ratings during the last 15 years.

How about Legislators in a Partisan Era?
It is reasonable to hypothesize that the rise of party voting and decline of the personal vote has reduced approval ratings for individual legislators. After all, citizens affiliating with the party opposite of the incumbent legislator may be less likely to approve of the legislator’s job performance.
Unfortunately, Gallup asked about the job performance of “the representative from your congressional district” only sporadically. When it has been asked, the approval rating of legislators’ job performance ranges between 45 and 65 percent—two or three times better than Congress. That was true even in the few times the question was asked in the last ten years.
We can do better by using a survey that asked the Congress and legislature job performance questions monthly over several years, late 2012 to early 2018.[4] As Figure 26-5 indicates, the monthly approval ratings for representatives, senators, and Congress. There are a few features of this period to note:
Representatives and senators receive very similar ratings, on average. The hunch that representatives, with smaller constituencies, have better ratings is not observed in this period.
Legislators have ratings that, on average, are less volatile than the president’s ratings.
The ratings of legislators and presidents stay well above the ratings of Congress.

All three time series varied within a narrow range, but it bears notice that the time series tend to move together. The correlations for representatives-senators, representatives-Congress, and senators-Congress are 0.62, 0.64, and 0.44, respectively. This suggests that the public’s views and representatives, senators, and Congress tend to move together, although the relationships are far from perfect. Legislators’ ratings probably are not immune from developments that influence the president’s ratings.
Missing Link
We need more direct evidence of that the correlation between partisanship (respondent relative to incumbent) and incumbent job approval has increased over the decades—and, over the same period, that the correlation between evaluations of the incumbent’s personal qualities and approval has declined. Other evidence supports these hypotheses. We know that partisanship is more strongly correlated with presidential approval now than it was a few decades ago. We know that party is more strongly correlated with the vote and straight-ticket voting has increased. And we know that there are fewer districts and states with legislators who do not match the partisan balance in their constituencies (Note 6).
Someone will do this for us. The American National Election Studies surveys have included approval questions in most election years since 1980. Unfortunately, ANES surveys that included the approval questions were conducted once every two years and just once every four years recently, which will give us only a crude basis for uncovering a stronger partisan effect. Still, I hope someone checks this out.
_______________
[1] Richard F. Fenno, Jr., "If, as Ralph Nader Says, Congress Is 'The Broken Br How Come We Love Our Congressmen So Much?" in Norman J. Ornstein, Congress in Change: Evolution and Reform (New York: Praeger, 1975); Glenn R. Parker and Roger H. Davidson, “Why Do Americans Love Their Congressmen so Much More than Their Congress?” Legislative Studies Quarterly , Feb., 1979, Vol. 4, No. 1 (Feb., 1979), pp. 53-61.
[2] For background on measuring the personal vote separate from the incumbency advantage, see Stephen Ansolabehere, James M. Snyder, Jr. and Charles Stewart, III, “Old Voters, New Voters, and the Personal Vote: Using Redistricting to Measure the Incumbency Advantage,” American Journal of Political Science, Jan., 2000, Vol. 44, No. 1 (Jan., 2000), pp. 17-34.
[3] A recent study by Tucker and Sinclair shows that the parallel patterns for the president and Congress are not accidental. Among individuals who were interviewed monthly for several years, change in presidential approval was correlated with change in congressional approval. Not surprisingly, individuals’ attitudes about Washington politics generally appear to influence evaluations of both the president and Congress. Patrick D. Tucker and Betsy Sinclair, “Dynamic Congressional Approval: An ALT-ernative Approach,” unpublished paper, June 18, 2019.
[4]The American Panel Survey, https://wc.wustl.edu/american-panel-survey. The questions are the standard Gallup job performance questions. The percentages reported here is the number responding strongly approve or approve as a percentage of all respondents. Unweighted responses. My approval ratings run somewhat lower than Gallup ratings. I include “not sure” in the denominator.