
Note 33. The Deep Small-State Bias of the U.S. Senate
Earmarks 2022 and the Distortions in Federal Policy


We have long recognized the deep distortion in representation associated with the equal representation of states in the U.S. Senate. Wyoming, at 576,851 people in the last census, is just 1.5 percent of the size of California. Both states have two senators. Less obvious is that Wyoming has one representative in the House of Representatives, as the Constitution guarantees, but its state population is only 75 percent of population of a district in California and most states. Wyoming’s two senators and one representative give it one legislator of Congress for every 192,283 persons; California swings only one legislator for every 732,189 people. These distortions will become greater as large states, due primarily their fast-growing urban areas, continue to grow at a faster pace than small states.
Earmarks as Distributive Policy
The reinstatement of earmarks in 2022 gives us another look at the built-in biases in federal policy making that are due to distorted representation. When the consolidated appropriations bill for FY2022 was finally enacted in March 2022, Congress funded nearly 5,000 projects with a total cost of about $9 billion. The transparency requirements imposed by the two appropriations committees required that the sponsors and recipients of requests and awarded earmarks be made public, which the committees have done. The transparency, of course, enables us to see who the winners are in the allocation of federal dollars.
Some Background
In many respects, earmarks in appropriations bills are the prototypical distributive form of policy—often called “pork barrel” policy. Most earmarks concern local projects—buildings, bridges, organizations, parks, water and sewer infrastructure, and so on—and have several important characteristics. No one project represents more than a tiny fraction of the federal budget so funding one project has a minimal effect on federal fiscal policy or funding other projects. Most projects have substantial benefits for a local constituency without having significant consequences for others. Most projects do not generate partisan conflict, nationally or locally. Earmarks can make a spending bill marginally more attractive to most legislators, Democrats and Republicans, and so may be useful for building a majority for a measure. Legislators can take credit for getting the projects funded, appear at events like groundbreaking ceremonies to advertise their role, and, for most projects, do this without much concern about making enemies with some voters. Moreover, more than many kinds of policy, earmarks can readily be collected and enacted under the guidance of a “universalism” norm—every legislator gets something for the asking.
Sometimes “pork” projects are associated with the process of building coalitions within Congress. The general argument is that legislators who are frequently pivotal to building majorities on legislation are going to receive “side payments” in the form of special provisions that benefit their districts or states. The pivotal legislators are likely to be more moderate legislators. Party plays a role, too—the majority party gives priority to building a majority for legislation that its own members and so majority party legislators who can be pivotal are more likely to receive side payments than minority legislators who could be pivotal. The projects funded by earmarks, it is said, “grease the wheels” by providing legislative leaders a method for buying the votes required to acquire a majority.[1]
The universalism and side payments stories are inconsistent. Universalism implies spreading the projects among legislators liberally; the side-payments account implies selectivity. In turns out that the 2022 appropriations earmarks, remarkably, are a weak fit to the side-payments perspective. Rather than operating only at the margins of building a floor majority, earmarks were a distinct feature of writing appropriations bills from the start. They were distributed in a nearly universalistic fashion—84 senators received earmarks that they requested. The others chose not to request earmarks. There was a partisan element, too. Majority party Democrats received more than twice as many earmarks than Republicans.
Of course, the 2022 outcome appeared to be a reversion to practices that had been banned. Earmarks have been subject to intense partisan and ideological argument for more than a quarter century, which is contrary to both the universalism account and side-payment story. Republicans and a few Democrats have seen earmarks as wasteful spending, as a currency used by legislators to buy their reelection with tax dollars, and as a strategy to entrench the current majority party. These views generated efforts to make earmarks and their sponsors public and eventually to a ban on earmarks in 2011 that was observed in the breach. Note 11 provides more detail.
Remarkably, after more than a decade-and-a-half of bans on earmarks, earmarks returned in 2021. Many legislators, including many Republicans, believed the ban on earmarks had shifted too much control over projects to the executive branch and limited their own ability to serve real needs in the communities they represent. Some of them also noted that the ban removed an opportunity for bipartisan policy making. The response was the adoption of committee and party rules that, effectively, made earmarks collectively a matter of policy—much more than mere tools for vote buying.
The Democratic leadership of the House Appropriations Committee adopted rules limiting representatives to 10 earmarks, requiring that earmark requests and awards be made public, and limiting total earmark spending to one percent of discretionary spending. The House Republican Conference changed their party rules to allow its members to propose earmarks. Senate Appropriations Democrats lifted their committee ban. The Senate Republican Conference voted against lifting its ban, but its leaders made clear that no senator would be punished for violating the rule. Most Senate Republicans, but not all, sought and received earmarks.
Several senators refused to request earmarks. Sixteen of the 50 Senate Republicans requested no earmarks—mostly the most conservative Republicans. The nonrequesters included Republican leader Mitch McConnell, notably, requested no earmarks and the Senate appropriators approved none for Kentucky. Two Senate Democrats, Jon Tester (MT) and Maggie Hassan (NH), requested no earmarks. These “losers” in the allocation of earmarks gave up earmarks as a matter of political strategy or ideological commitment. Most of their states won earmarks because the seat mate or House delegation members requested earmarks. In the end, only Montana, North Dakota, and Wyoming received no earmarks. Losing out on earmarks had nothing to do with legislators’ status as non-pivotal votes for the enactment of the appropriations package. In fact, about half of the Republicans receiving earmarks voted against the package.[2]
The Small-State Bias in Policy
Insiders and close observers have recognized the deep bias in policy making that representational distortion generates. Lee and Oppenheimer’s Sizing Up the Senate, now 23 years old, demonstrated that small states gain federal spending in a wide range of federal programs, often wildly out of proportion to their populations. [3]
This bias has long had defenders. The primary argument is that all Americans deserve similar levels of services and infrastructure from government. This necessarily means that providing the same level of service and essential infrastructure requires more spending per person in less-populated, rural states than in large, densely populated states. These defenders of the Senate’s small-state bias observe that the House, whose members represent districts of (very) roughly equal size, are unlikely to give adequate priority to the extra costs of providing services in low-population, low-density locales. In this view, the small-state bias of the Senate is a necessary corrective to the House.
On the other side of the equation is that a larger population density entails some additional costs. For example, urban areas require more interchanges and more expensive accommodations for utilities than do more rural areas. Urban areas also shoulder the cost of arenas, music venues, and other facilities the serve a wide region. Plainly, the balance of costs for urban and rural, large and small states varies across government programs.
The necessity of gaining both House and Senate approval serves as a check on policy that might favor large, urban states if the House dictated outcomes or small, rural states if the Senate did. There are several ways in which the interests of large, urban states and small, rural states are balanced, including formulas that guarantee minimum levels of benefits for states or allocate funding on the basis of geography rather than population. Earmarks are seen as a critical way, at least by small-state senators.
The 2022 Earmarks
The heavy small-state bias in the distribution of 2022 earmarks can be illustrated with either the number of projects funded in earmarks or the cost of those projects. The same patterns are obvious in both so I stay with the number of earmarks per state.
To appreciate the challenge of allocating earmarks, it is useful to see the distribution of state populations. Figure 33-1 demonstrates the heavy skew to that distribution.

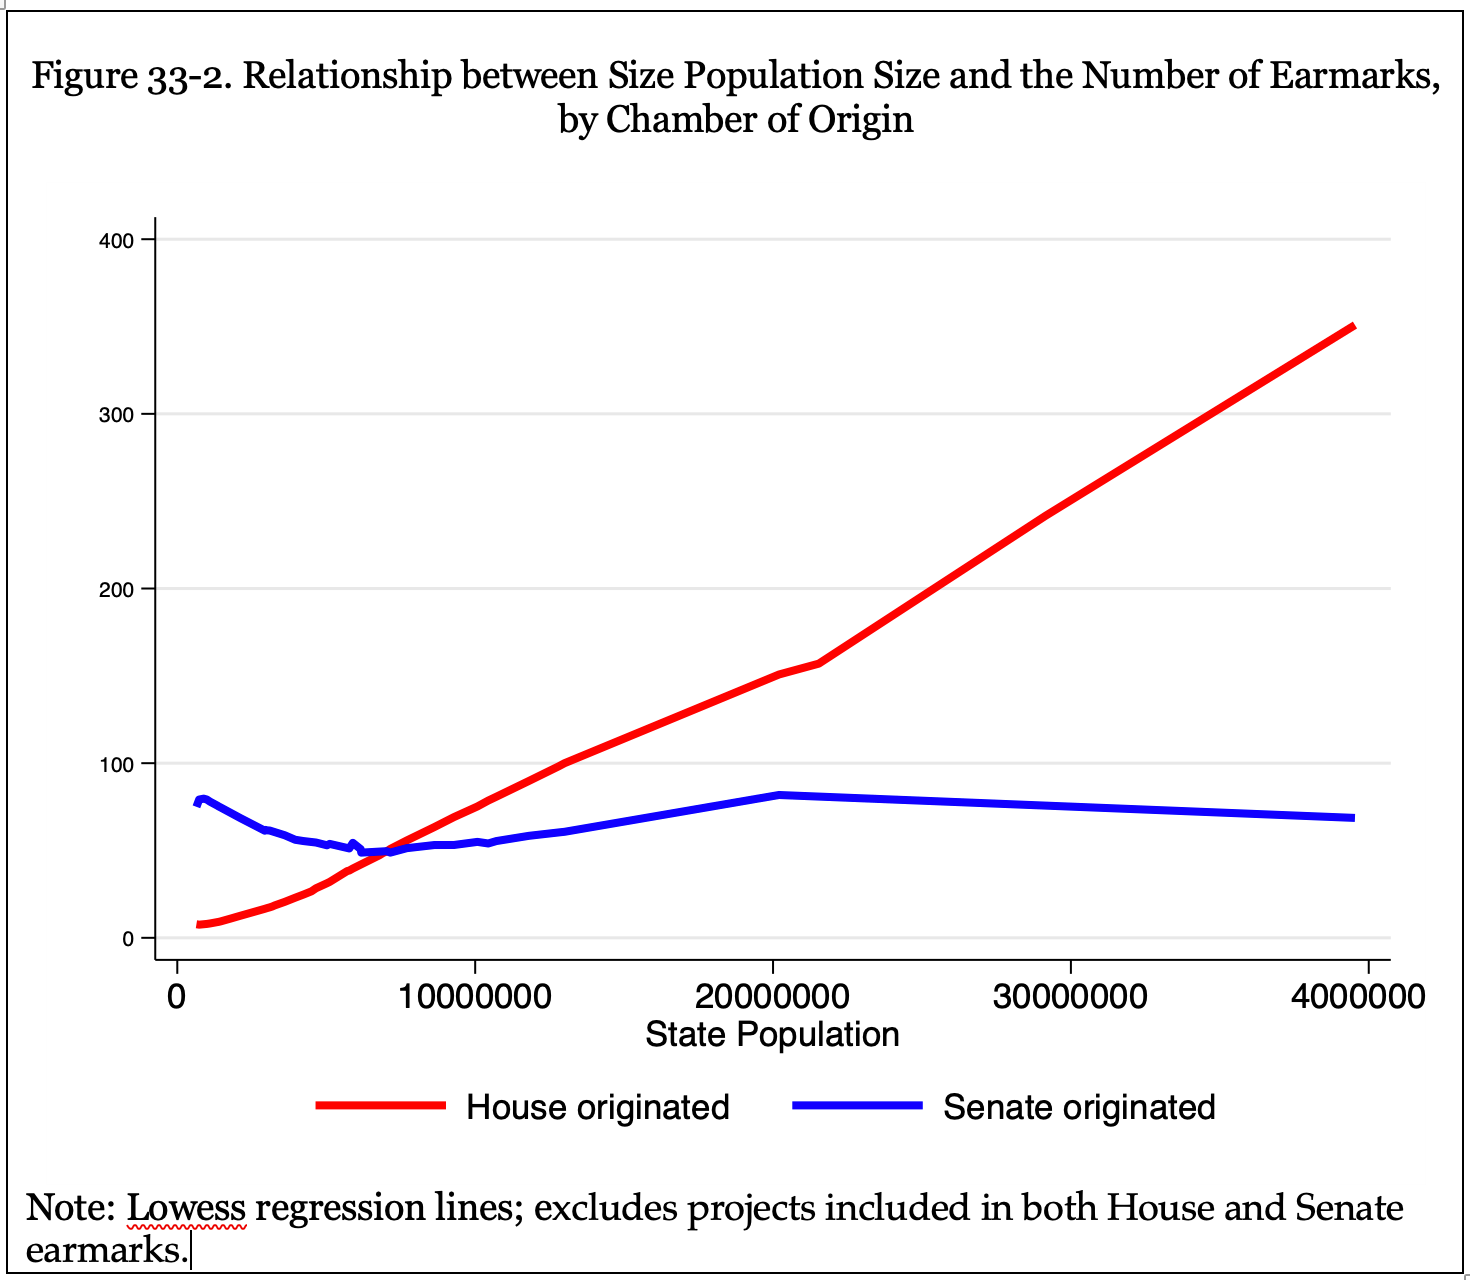
A first look at the distribution of awarded earmarks is provided in Figure 33-2. The figure illustrates how the population size of a state is related to the number of earmarks received, counted separately for earmarks that were requested by a senator and those requested by a representative. Not surprisingly, for earmarks originating in the House, larger states, with more representatives, received more earmarks. Senate-originated earmarks varied in number in a much small range, roughly 50-80, with little correlation between the number of earmarks and state population size. Plainly, the pattern of House-originated earmarks maps well to the distribution of state populations, but the Senate-originated earmarks do not.
If we simply add the number of House-originated earmarks to the number of Senate-originated earmarks, we come to the obvious conclusion that there is some relationship between population size and the number of earmarks received for the 50 states. There is. However, the population ratio of the largest to the smallest state receiving any earmarks (California to Vermont) is 61-to-1, but the ratio for the largest to smallest for the number of earmarks is only 7-to-1. That is nearly a ten-fold difference and stands as a reasonable indicator of the small-state bias in earmarks.

Figure 33-3 provides essential details. It illustrates that Vermont, Alaska, Rhode Island, Maine, and West Virginia did exceptionally well, at least on a per capita basis. Senate Leahy of Vermont chaired the Senate Appropriations Committee. Three of the smallest states—Wyoming, North Dakota, and Montana—suffered because their senators refused to request earmarks.
Figure 33-4 goes a step farther by showing per capita earmarks for each house, setting aside the three states that received no earmarks. The figure demonstrates how small states benefit from their Senate representation. The states below the mean in the population distribution acquired earmarks greatly out of proportion to their size. The seven states above the mean population average far, far fewer earmarks per capita than the small states even when the large states are awarded more earmarks.

How Should We Interpret the Senate’s Small-State Bias?
The tremendous “malapportionment” that the Constitution provides for Senate representation is, on balance, difficult to justify. The Constitution violates the one-person-one-vote principle that we take as fundamental to democracy. In my view, the burden of proof rests with the current arrangement and the arguments for equal representation of states are quite weak.
The Constitution and the Framers’ arguments provide inadequate justification for equal representation of states in the Senate. It is undeniable that equal representation of states in the Senate played a critical role in the design and ratification of the Constitution. It is equally undeniable, however, that the Framers of the Constitution and the authors of the Federalist Papers did not, and could not, have anticipated the distributional consequences of the Senate’s representational distortion on public policy. They could not anticipate the breadth and depth of federal policy and the extended reach of federal agencies in American life. They could not anticipate the disparity in state sizes that we now experience and will only increase in the next few decades. Moreover, they could not anticipate direct election of senators, creating a Senate that was not nearly so different from the House than the one imagined by Madison and other Framers.
The need to adjust policy choices for the varying costs of providing comparable services and benefits in quite different localities certainly is a consideration that warrants consideration. However, the ten-fold advantage of small states in earmarks is difficult to justify on the basis of varying needs. Measuring needs, of course, is a complicated matter, but one such effort found a huge small-state advantage in federal spending even taking need into account.
Intensifying Concern about the Small-State Bias
As the disparity in per-person representation in the Senate between large and small states has grown, popular and scholarly interest has grown and efforts to measure the partisan implications are multiplying. The Republican advantage is well known: When the Senate was split 50-50 between Democrats and Republicans in 2021-2022, for example, Democrats represented over 56 percent of Americans. As large states continue to grow faster than the small states, this disparity will grow.
Another question to ask is how often senators representing a minority of Americans win Senate roll-call votes. Two recent efforts put numbers on this.
One study asks how often a Senate in which seats were assigned to states in proportion to their populations would have produced a different vote outcome than the actual outcome. Examining Congressional Quarterly’s 804 “key votes” for the 1961-2019 period, just over 17 percent of the votes would have had the reverse outcome with proportional representation. Moreover, the bias overwhelmingly favored Republicans over Democrats. [5]
The second study is more comprehensive, covering all Senate roll-call votes for 1789-2022. About 12 percent of all votes produced “countermajoritarian” outcomes, a bit less than 17 percent for key votes in recent decades. The study goes much farther by considering the combined effect of the Senate’s supermajority threshold for cloture, in place since 1917, and malapportionment. The votes of interest are the ones on which a majority of senators, but less than the two thirds or three fifths required for cloture, voted for cloture and lost. These are the votes on which we might assume that a simple majority favored action on a measure but were blocked by a large minority. Of these 569 votes for the 1917-2022 period, 417 (73 percent) produced a vote on which senators representing a minority of Americans were on the winning side that prevented cloture. In recent decades, this pattern heavily favored Republicans. Plainly, the supermajority threshold for cloture, which creates blocking power for large minorities, can and often does multiply the distorting effects of Senate malapportionment.[6]
__________________
[1] For a review of the political science theory and empirical studies on “vote buying,” see Dan Alexander, Christopher R. Berry and William G. Howell, “Distributive Politics and Legislator Ideology,” Journal of Politics (2016)78:1, pp. 214-231.
[2] Peter Cohn, Ryan Kelly, and Herb Jackson, “In the Game of Earmarks, Shelby Has No Peers,” Roll Call, March 16, 2022.
[3] There are many studies of the small-state bias. The most comprehensive study is Frances Lee and Bruce Oppenheimer, Sizing Up the Senate (University of Chicago Press, 1999). In addition to Lee and Oppenheimer, a particularly useful study is William R. Hauk Jr. and Romain Wacziarg (2007), "Small States, Big Pork,” Quarterly Journal of Political Science (2007) 2:1,, pp 95-106.
[4] Data on earmarks are available at https://www.appropriations.senate.gov/congressionally-directed-spending-requests and https://appropriations.house.gov/transparency. Data used in this Note are taken from the compilation provided by the Bipartisan Policy Center: https://bipartisanpolicy.org/blog/congressionally-directed-spending-fy2022-dataset/.
[5] Richard Johnson and Lisa L. Miller, “The Conservative Policy Bias of US Senate Malapportionment,” PS (2022): 1-8 (https://doi.org/10.1017/S1049096522001111).
[6] C. Lawrence Evans, “Senate Countermajoritarianism,” Paper prepared for presentation at the annual meeting of the Southern Political Science Association, St. Pete Beach, Florida, January 11-14, 2023.